Undark Magazine Feature
Published:
I was recently interviewed by Sarah Scoles for Undark Magazine, and discussed my dissertation and it’s findings. In the article, Sarah also highlights the fascinating work that Will Rice at the University of Montana is conducting to help better understand and “nudge” visitor behavior to align with protected area conservation goals.
In the article I shared findings from Chapter 3 of my dissertation (link) where I discussed how I evaluated whether trail management strategies like directional or activity-specific trail regulations have an effect on trail conditions and long-term trail sustainability. I found that although these strategies are well used across protected areas with multi-use trails, they haven’t been evaluated for their effects on trail conditions, but they do seem to help mitigate conflict between visitors and increase perceptions of safety where pedestrians and cyclists intermingle.
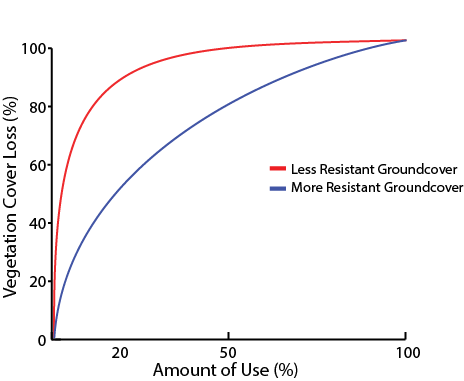
The Use-Impact relationship in Recreation Ecology is one of the foundational “theories” in the field, but it can seem a bit abstract to some. The basic idea is as I mention in the article, that the majority of disturbance generated from visitor use comes from the initial use, while the proportional impact of the use that follows is much smaller. In short, given sustainably constructed and designed trails, increased use will not lead to a proportional increase in disturbance - but the increased use will have an effect on the visitor experience (e.g., perceptions of safety, solitude, etc.). I thought I’d include a visual to help illustrate the curve-linear or sigmoidal relationship between use and impact below which I adapted from Hammit,Cole, Monz (2015).

The use-impact functional relationship illustrated with two different ground cover types. With the initial 20% of use, the vegetation cover loss proceeds rapidly following an exponential relationship, but with additional use, the curve starts to flatten. The red line is a less resistant ground cover, such as a forb or herb with above ground stems, while the blue line is a more resistant ground cover like a grass or rhizome with below ground roots.
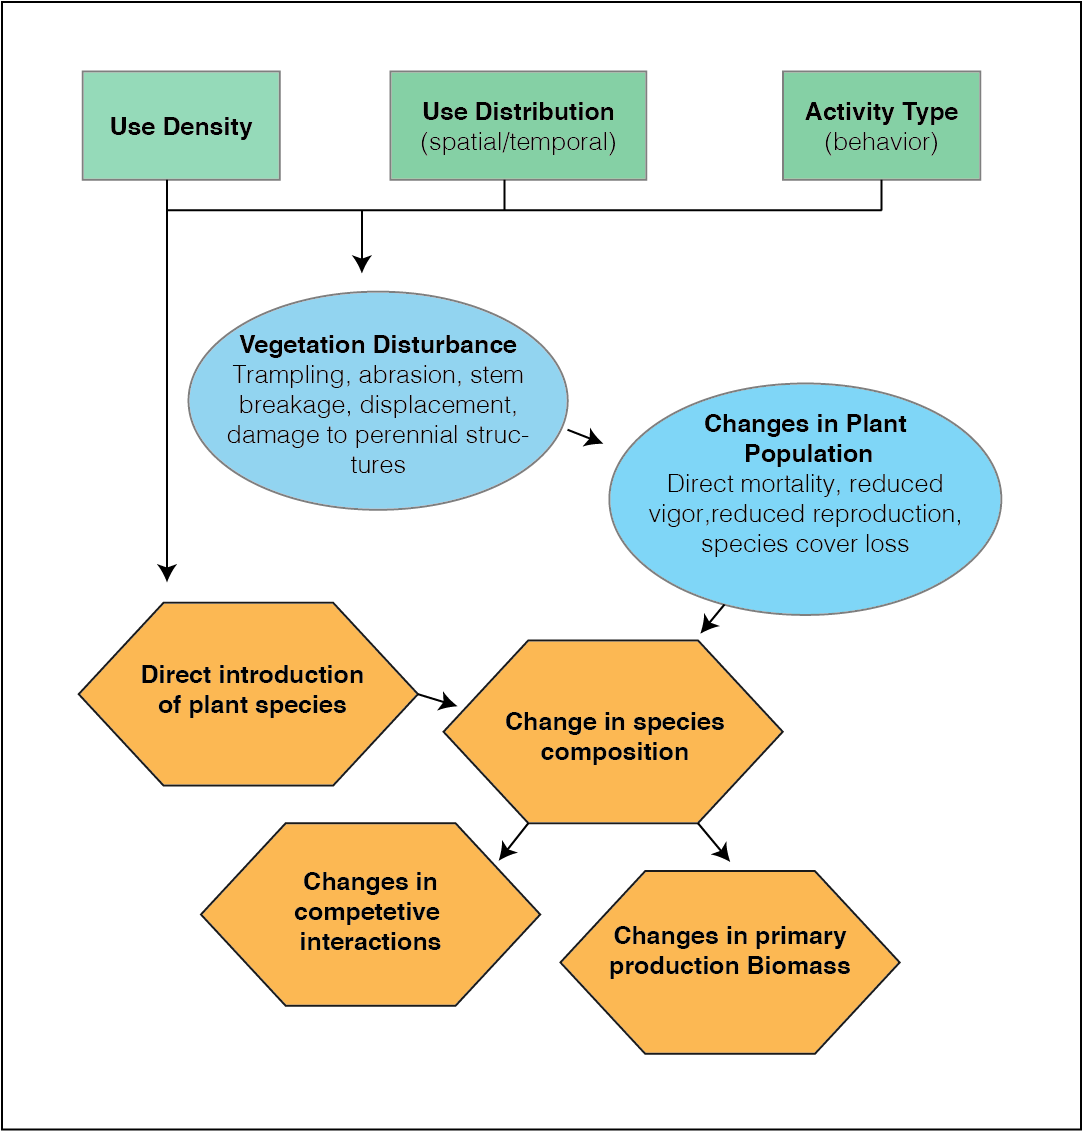
This relationship is a foundational concept in recreation ecology, and different functional response curves have been proposed for many different types of taxa and biotic and abiotic resources. Although this figure illustrates a relatively simple relationship between recreation use and disturbance, it’s really based on a number of different factors that are pretty well summarized in this conceptual diagram:

Conceptual diagram illustrating the drivers, mediating factors, and changes to ecological systems as a result of recreation use. The green boxes at the top (use density, distribution, and activity type (behavior)) drive the interactions with ecological resources (e.g., vegetation, soil, wildlife)..
One of the interesting things about Recreation Ecology, like in the above description of the use-impact curve is the inter-relationship between social ane ecological systems. On one hand, we want to mitigate the disturbance from recreation, on the other hand, disturbed areas serve and important function to concentrate use. Most of the time, if you’re heading out for a backpacking trip, you’ll find the trailhead and follow the trail and when you arrive at your destination you’ll probably look for a spot that is well defined, flat, and probably already has a fire-ring. Protected area managers can take advantage of this convenience bias to help concentrate use and mitigate proferation of impacts, because at times these impacted areas serve as an amenity.
